 English
 العربية
 فارسی
فارسی

3D Visuals, Just Like Being There
3D Visualization with Real Time Data—From Any Web Browser
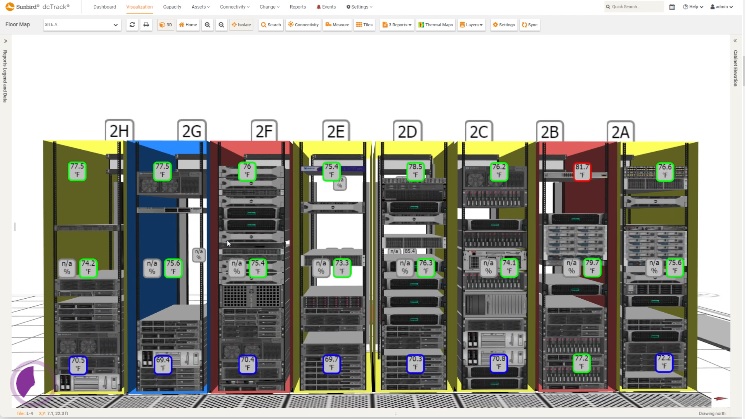
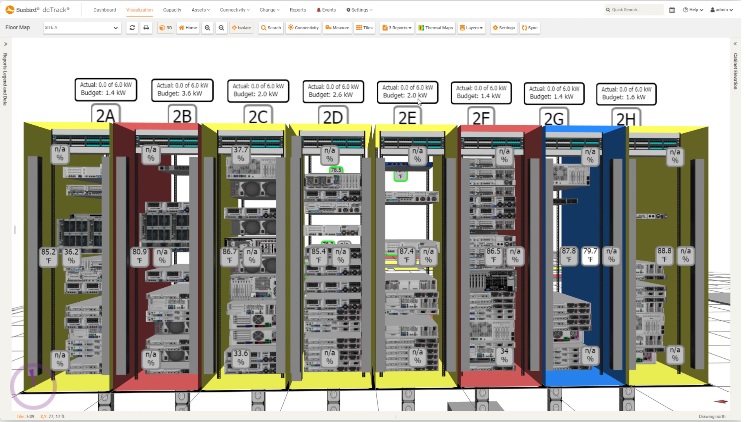
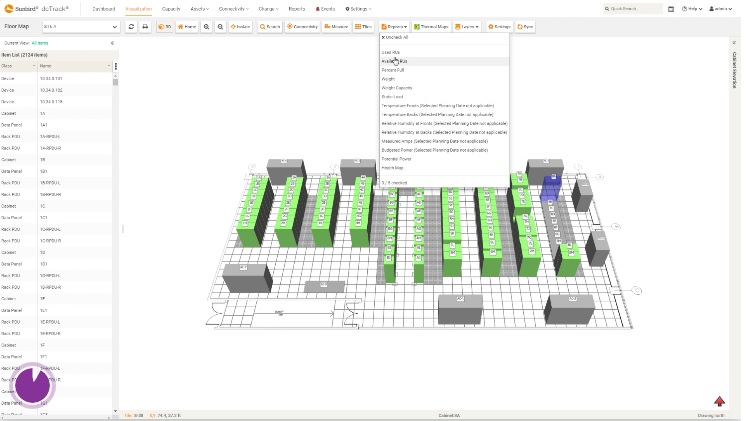
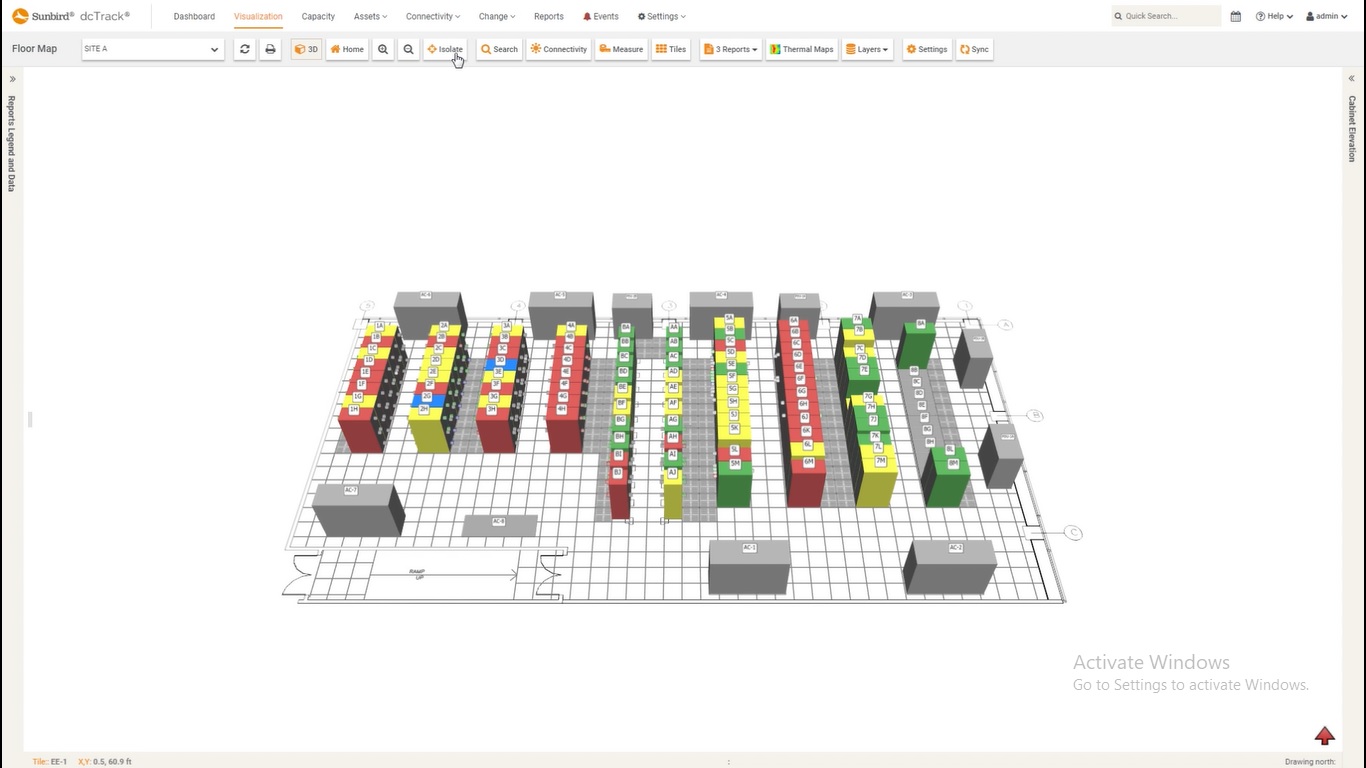
Remotely navigate your data center as if you’re there. See rack and row elevations. Correlate multiple space, power, and environmental reports for a real-time, accurate view of data center capacity. Isolate cabinets to view where and how devices are placed and connected. Analyze sensor readings for entire rows and racks in a single screen.SmartDCIM’s better-than-being-there 3D floor map visualizations help you stay informed about what’s going on in your data center—without leaving your desk.
Share :
Add New Comment